Solar System Producing Less Power Than Expected? A 10-Step Diagnosis
How much should your rooftop solar system really generate in India, and how to find out why it's producing less — from weather and soiling to shading, inverter clipping, string faults, degradation and monitoring errors.
"My solar system isn't producing what the installer promised." It's the most common complaint in residential solar, and also one of the most misunderstood. Sometimes there's a genuine fault — a dead string, a failed diode, heavy soiling. Often, the expectation was wrong in the first place, or the comparison is unfair (a cloudy July compared with a sunny March).
This guide helps you separate the two. It starts with what's realistic in Indian conditions, then works through a 10-step diagnosis from the simplest checks to the technical ones.
Quick answer
A well-installed rooftop system in most of India typically generates around 3.5–4.5 kWh per kWp per day averaged over a year (roughly 1,300–1,650 kWh/kWp/year), with large seasonal variation. Compare like with like: same month, similar weather. If output is genuinely low, the usual culprits are soiling, new shading, inverter trips or derating, a failed string or diode, and monitoring errors. Work through the steps below in order.
What should my system produce?
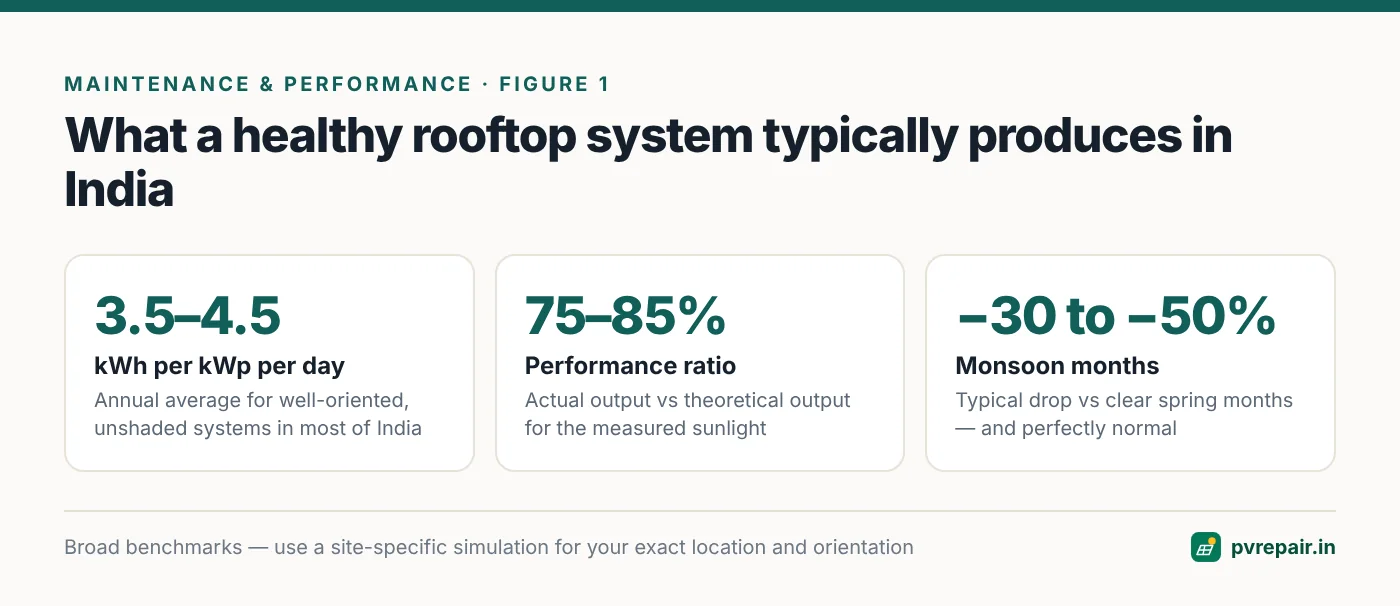
Generation depends on location, orientation, tilt, shading, module and inverter efficiency, temperature and soiling. For a rough benchmark:
- Specific yield (kWh per kWp of installed panels) averages roughly 3.5–4.5 kWh/kWp/day across much of India over a year, higher in sunny western and southern regions and lower where monsoon cloud cover is heavy or winters are hazy.
- Seasonal variation is large. Clear spring months (March–May) are usually the best; monsoon months (July–August) can be 30–50% lower; winter in the north can be reduced by fog and haze.
- Performance ratio (PR) — the ratio of actual output to theoretical output given the measured sunlight — is typically around 75–85% for a well-performing rooftop system.
So a 5 kWp system might produce around 17–22 kWh on a typical good day, and around 6,500–8,000 kWh in a year — but a very cloudy monsoon day might produce only 5–8 kWh, and that's perfectly normal.
Use the right comparison
Compare this month with the same month last year, or compare your system with a similar system nearby, or use an online solar estimate for your exact location and orientation. Comparing July with March tells you about the weather, not your system.
The 10-step diagnosis
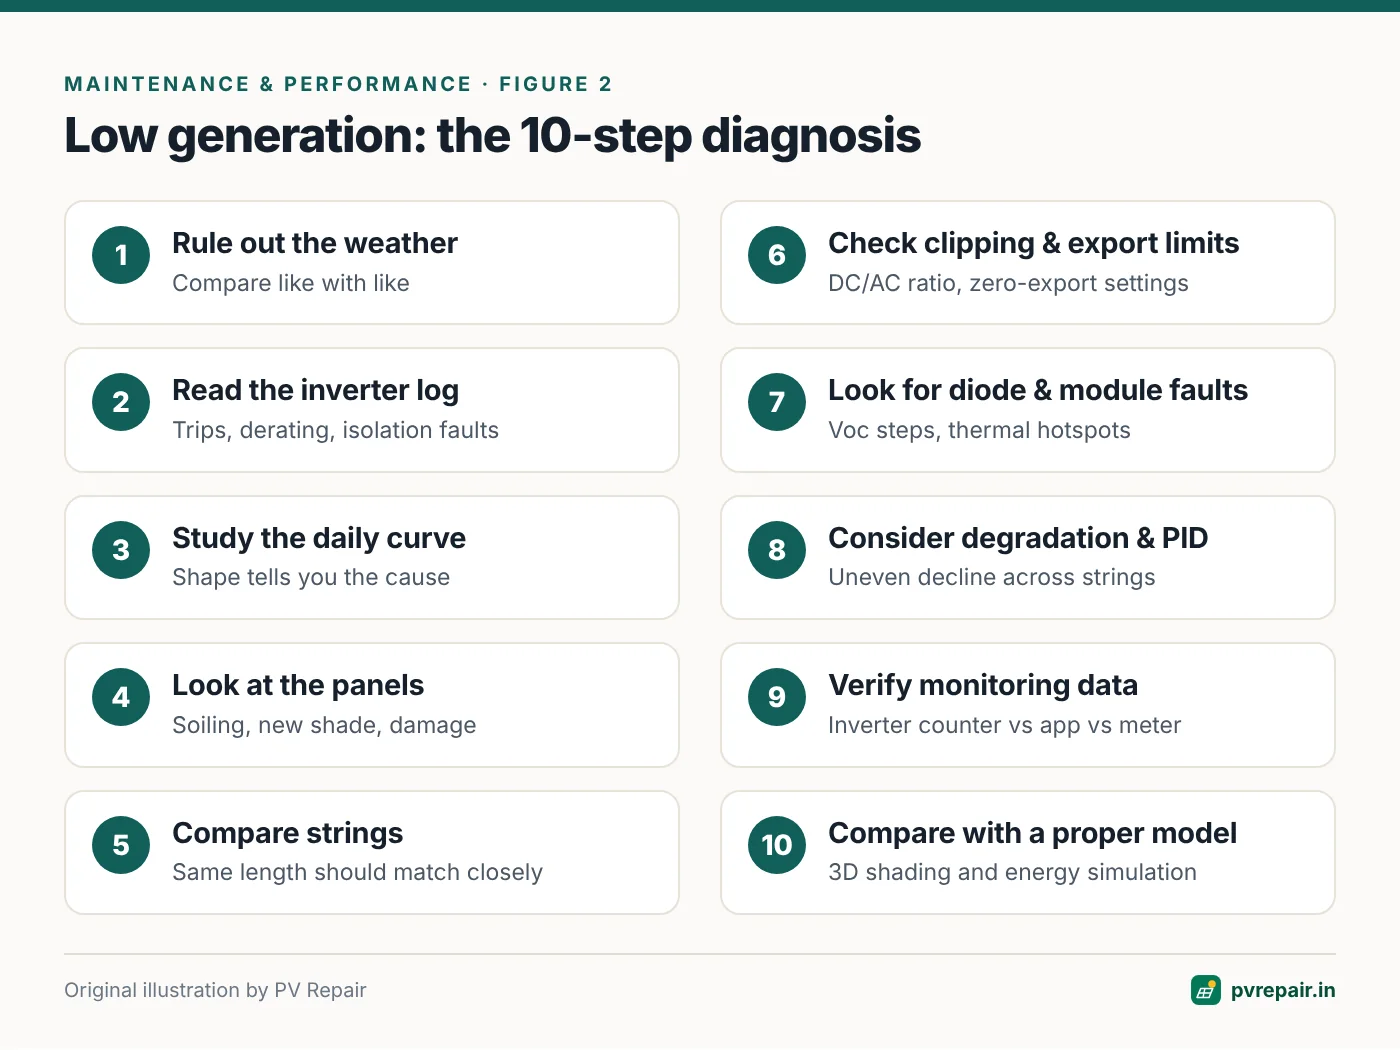
Step 1: Rule out the weather
Check how cloudy, hazy or rainy the period was. A week of monsoon clouds, dust storms, or winter fog will dramatically reduce generation. Smog and haze in northern Indian winters can cut irradiance significantly even on "clear" days.
Step 2: Check the inverter status and event log
Is the inverter running? Look for fault codes: grid trips, isolation faults, overtemperature, or communication drop-outs. A system that trips off for an hour every afternoon loses a lot of energy. Our guide to reading inverter fault codes helps you categorise them, and specific guides cover grid overvoltage trips and overheating and derating.
Step 3: Look at the daily generation curve
The shape of the daily power curve on your monitoring app is the single most useful diagnostic tool. On a clear day it should be a smooth bell shape.
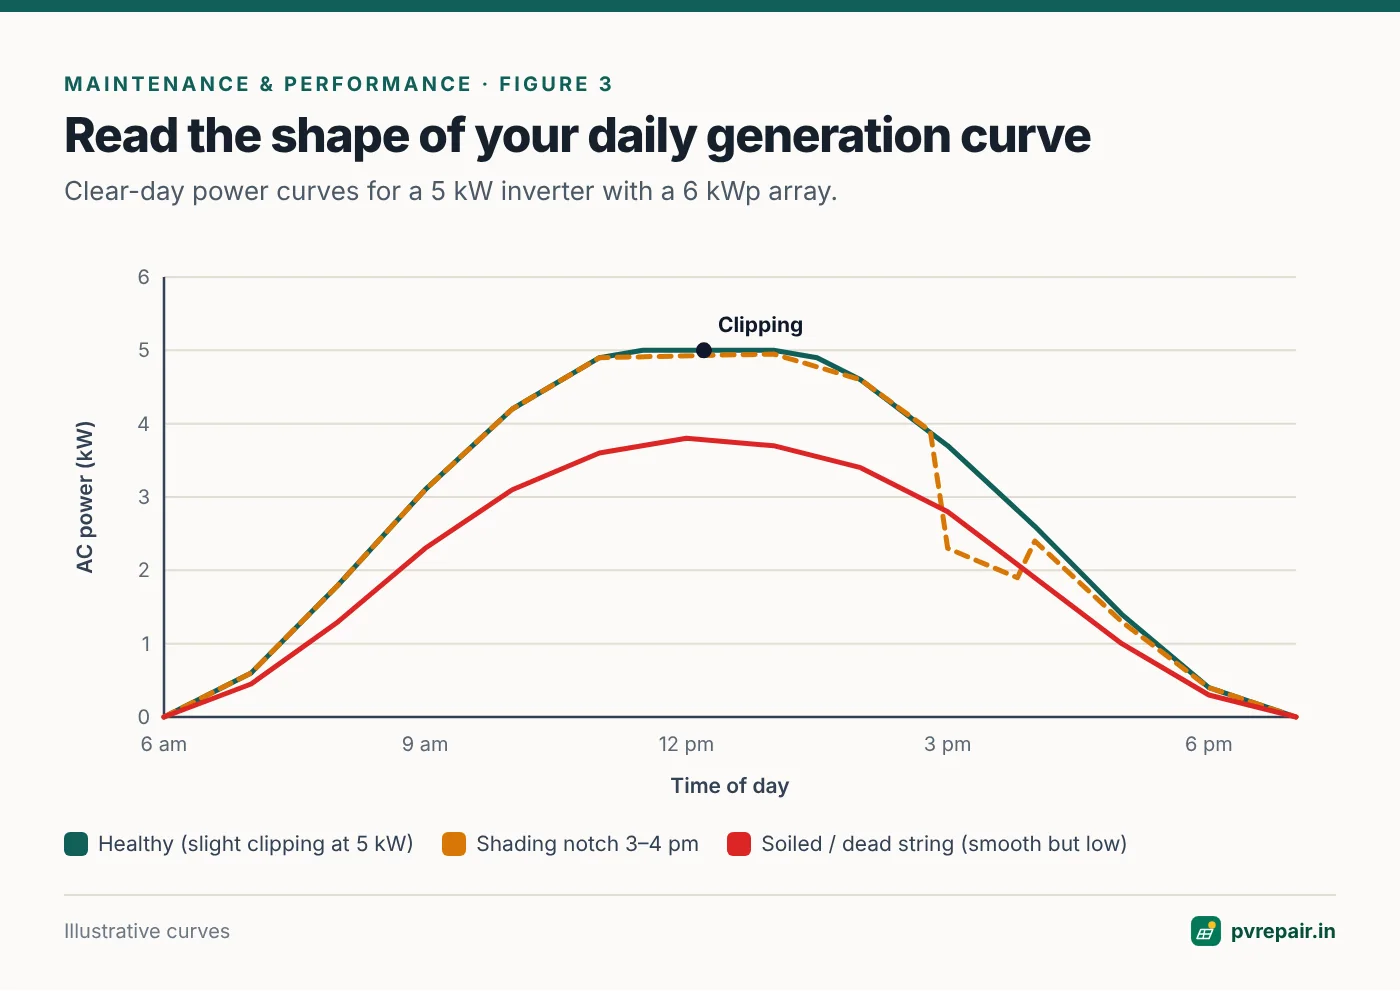
- Smooth but low bell: soiling, degradation, a dead string, or haze.
- Flat top at inverter rating: clipping — normal if the array is larger than the inverter.
- Flat top below inverter rating or a dip in the afternoon: thermal derating or export limits.
- Notch or step at the same time each day: shading from a building, tree, tank or parapet.
- Late start in the morning: insulation issues on humid mornings, or start-up voltage problems.
- Saw-tooth with drops to zero: grid voltage trips.
Step 4: Look at the panels
From a safe position, look for:
- Soiling — dust, bird droppings, leaves. In dry months, dust can reduce output by several percent per week on some sites. See our cleaning guide.
- New shading — a new water tank, a neighbour's extra floor, a growing tree, a satellite dish, a mobile tower.
- Physical damage — broken glass, discoloured areas, burn marks.
Step 5: Compare strings
If your inverter has several strings or MPPT inputs, compare their current or power in the app. Strings with the same number of modules and orientation should be very close. A string producing much less, or nothing, points to a string fault: a failed connector, blown fuse, chewed cable or failed module. See string testing.
Step 6: Check for clipping and export limits
If your inverter is smaller than your panel array (a DC/AC ratio above 1.0), it limits output at its rating on bright days — clipping. A modest amount of clipping is normal design practice. But a heavily oversized array or a mistakenly configured power limit can cost significant energy. Also check whether a zero-export or export-limit setting is restricting output when household consumption is low.
Step 7: Check for failed bypass diodes and module faults
A string voltage lower than expected by about a third of one module's voltage indicates a shorted bypass diode. Thermal imaging finds hotspots, damaged junction boxes and cell defects.
Step 8: Consider degradation and PID
Panels lose a little output each year — typically around 0.4–0.7% per year for modern modules, after a slightly larger first-year drop. That's built into warranties. Faster, uneven degradation across strings may indicate potential induced degradation.
Step 9: Verify the monitoring data
Monitoring systems can be wrong. A Wi-Fi drop-out may leave gaps that look like zero generation. A wrongly configured CT or meter can under-report. Compare the inverter's own total energy counter (on its display) with the app, and with your net meter's export register. See monitoring problems and net meter issues.
Step 10: Compare with a proper energy model
If everything checks out but output is still below expectations, compare with a proper simulation for your exact site — location, orientation, tilt, shading, module and inverter models. Many installers' "promised" figures are optimistic rules of thumb. Design tools with 3D shading analysis give a realistic figure. See our guide to 3D solar design software for EPCs.
A worked example
Here's a composite but typical case. A homeowner in a large city has a 5.4 kWp system (10 × 540 Wp modules in two strings of five on a 5 kW single-phase inverter). In April they see 18 kWh on a good day, and feel that's low because "5 kW × 5 hours should be 25 kWh".
- Benchmark. At about 4.2 kWh/kWp/day for a clear April day at this location, the expected output is roughly 5.4 × 4.2 ≈ 22–23 kWh. So 18 kWh is about 20% low — worth investigating, but the "25 kWh" expectation was too optimistic to begin with.
- Weather. The past week was clear. Not the cause.
- Inverter log. No trips. Internal temperature peaks at a normal level.
- Daily curve. A smooth bell, but lower than expected, and no clipping at 5 kW on clear days. That suggests something reducing the whole array or one string, rather than shading at a particular time.
- Strings. The app shows string 1 at about 9 A at midday and string 2 at about 6 A. The strings are identical in length and orientation, so string 2 is clearly underperforming.
- Inspection. The modules of string 2 sit along the parapet edge. They carry a thick dust ridge along the bottom of each module and several bird droppings. String 1, further from the parapet, is much cleaner.
- Result. After cleaning and fitting bird deterrents on the parapet, string 2 matches string 1 within a few percent, and daily generation rises to about 22 kWh on clear days.
The lesson: a realistic benchmark plus a string comparison found the problem in under an hour, with no specialist tools.
Month-by-month expectations
Generation in most of India follows a broadly similar pattern through the year, though the timing shifts by region:
- February–May: usually the best months, with clear skies and long days; output may dip slightly in the hottest weeks as module temperatures rise.
- June–September: monsoon cloud cover reduces output significantly, and the number of good days varies greatly by region.
- October–November: recovery with clearer skies, often very good generation.
- December–January: shorter days and lower sun angles; in the north, fog and haze can reduce output considerably.
Keep a simple monthly record of generation. After a year, you'll have your own benchmark, which is more useful than any rule of thumb.
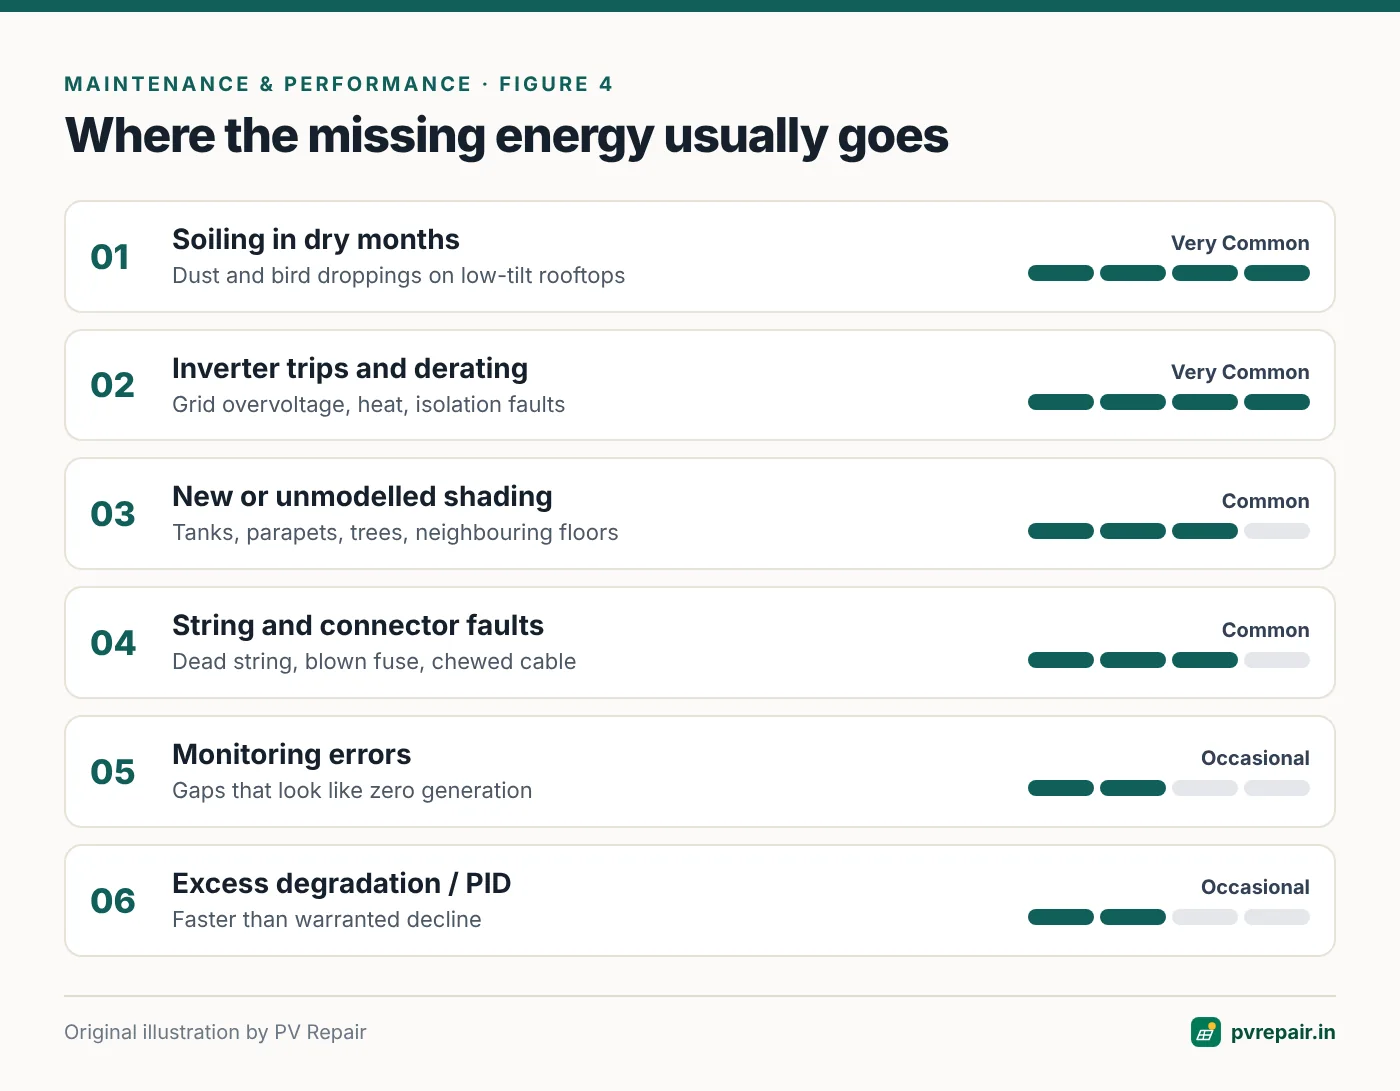
Typical losses at a glance
When to call a professional
Call your installer or a qualified technician if:
- The inverter shows repeated fault codes.
- One string produces much less than the others.
- You see physical damage, burn marks or smell burning.
- Output is consistently well below the same period last year, with similar weather, and cleaning doesn't help.
A good technician will check string voltages and currents, insulation resistance, thermal images and inverter logs — and should give you a written report.
Frequently Asked Questions
How many units should a 1 kW solar system generate per day in India?
On average across a year, around 3.5–4.5 kWh (units) per day for a well-oriented, unshaded system in most of India, with lower values in cloudy months and higher in clear spring months.
Why is my solar generation lower in summer than in spring?
Panels lose efficiency as they get hotter, and summer haze and dust reduce sunlight. In the monsoon, cloud cover reduces output further. Spring often has the best combination of clear skies and moderate temperatures.
How much does dust reduce solar output?
It depends on location and tilt. In dusty conditions, losses of several percent per week are possible on low-tilt rooftops without rain. Regular cleaning in dry months recovers most of it.
Is it normal for my inverter to cap output at midday?
If your panel capacity is larger than the inverter's rating, yes — that's clipping and is often a deliberate design choice. If output is capped well below the inverter's rating, check for derating or export limits.
Can a single bad panel reduce output of the whole system?
It can reduce the output of its whole string, because modules in series share current. Inverters with multiple MPPT inputs isolate the effect to one string.
Related guides

Annual Solar PV Maintenance Checklist for Homes and Commercial Rooftops
A complete, practical annual maintenance checklist for rooftop solar in India — visual inspection, modules, structure, DC and AC wiring, inverters, earthing, batteries, monitoring and documentation — with what owners can do and what needs a technician.
Solar Monitoring Offline? Fixing Wi-Fi Dongle, Data Logger and App Problems
Why solar inverter monitoring goes offline — router changes, 2.4 GHz vs 5 GHz Wi-Fi, weak signal, power cuts, server and account issues — and a step-by-step method to reconnect Wi-Fi sticks, Ethernet loggers and 4G dongles.
Net Meter Problems with Rooftop Solar: Export Not Recording, Wrong Readings and Billing Issues
How bi-directional net meters work, how to read import and export registers, and how to troubleshoot export not recording, unexpectedly high bills, wrong CT polarity, and meter-related inverter faults with your DISCOM.